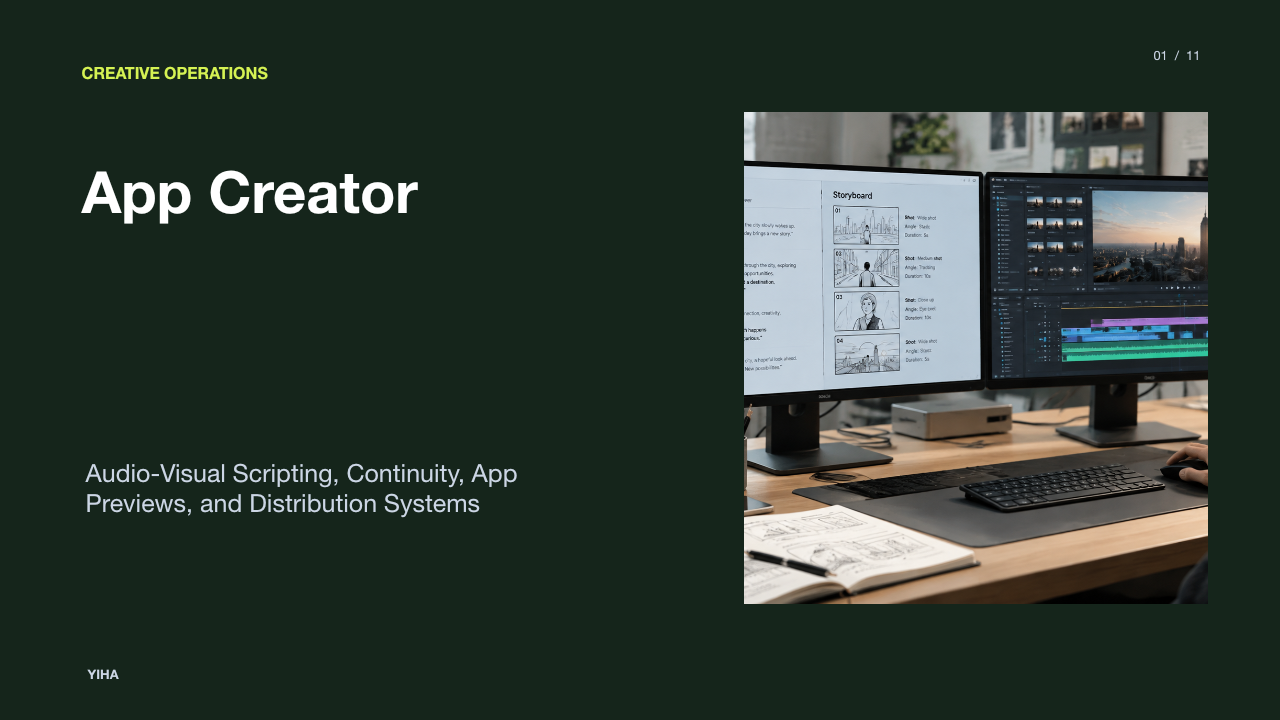
Storytelling Ux Presentation
Discover how UX professionals apply narrative structure, storyboarding, and journey mapping to transform technical findings into memorable stakeholder presentations.
Free download · 4.9 MB11 editable slides · PowerPoint format
Download the editable PPTX
PPTX · 4.9 MB · 11 editable slides · Free to edit and reuse with attribution to Yiha.ai
View every slide
Use ← →, Home/End, or swipe on mobile

User experience professionals routinely face a fundamental communication challenge: presenting deep, rigorous design research to cross-functional stakeholders who do not share a design background. When findings are delivered as disjointed interface mockups, isolated usability severity ratings, or decontextualized spreadsheets, stakeholders often struggle to see the human impact behind the data. Applying narrative architecture bridges this divide. By framing design observations through structured stories, UX practitioners connect user struggles directly to strategic business decisions, fostering genuine empathy and cross-functional buy-in.
Why User Experience Teams Need Narrative Structure
Traditional design readouts frequently flounder because they present tactical deliverables without human context. Reviewing interface layouts or component specifications screen by screen creates emotional detachment among stakeholders who care primarily about strategic outcomes. As highlighted by the Nielsen Norman Group in their analysis of UX Stories Communicate Designs, human memory retains facts far more reliably when information is bound within a coherent story rather than presented in isolation. Unconnected bullet points force audiences to perform mental gymnastics to assemble meaning, whereas narratives offer an intuitive mental model that aligns product managers, engineers, and executive sponsors.
Furthermore, narrative communication creates a shared vocabulary across diverse departments. When design teams ground conversations in human context, they prevent subjective arguments over button colors or visual preferences. According to research on Data Storytelling: How to Present Data That Persuades, combining empirical insights with narrative context helps cross-functional partners understand why a particular pattern matters and what decision must follow. Rather than viewing usability findings as arbitrary design preferences, stakeholders come to see interface changes as essential interventions that alleviate concrete user friction.
How the Human Brain Processes Stories Versus Isolated Facts
Human cognitive architecture is fundamentally wired to interpret experiences through causality, sequence, and character motivation. Experimental psychology demonstrates that disconnected data points trigger analytical scrutiny without emotional connection. In classic cognitive experiments, such as Bartlett's 1932 study referenced in UX Stories Communicate Designs, subjects recalled connected narrative information with higher coherence because story structures match how human memory synthesizes episodic events. When listeners hear a story, they do not merely log isolated numbers; they reconstruct the character's internal motives and situational pressures.
Secondary industry commentary, including frameworks discussed in 7 Storytelling Frameworks for Pitch Decks That Hold Attention, notes that narrative structures stimulate engagement by pairing factual proof with contextual tension. While technical reports activate critical evaluation alone, stories anchor analytical observations within concrete experiences. This dual processing ensures that audience members retain key findings long after the presentation concludes, transforming passive attendees into active advocates for user-centered changes.
Structuring Design Presentations With the Story Triangle
Classical dramatic architecture provides a robust template for structuring complex design reviews. Drawing inspiration from classical dramatic traditions outlined in 6 Rules for Persuasive Storytelling, persuasive presentations require defined characters, authentic conflict, and meaningful resolution. In a design presentation, the user serves as the central protagonist rather than the product itself. As analyzed in Presentation Storytelling 101: Craft Clear, Compelling Messages, moving away from generic slide topics toward benefit-driven narrative progression allows presenters to illustrate clear transformation across time.
An illustrative example of a presentation story arc involves the following progressive stages:
- The Protagonist and Baseline Context: Introduce the user, their practical environment, and their primary goal.
- The Inciting Conflict: Reveal the friction points, interface hurdles, or system failures that obstruct this goal.
- Rising Tension and Impact: Articulate the cost of that friction, demonstrating both user frustration and organizational impact.
- The Resolution: Present the proposed interface intervention, showing how the design removes roadblocks and restores workflow efficiency.
Organizing a slide deck around this progression prevents the common trap of displaying a flat catalog of screens. Instead, it positions design proposals as logical resolutions to documented customer struggles.
Transforming User Research Data Into Factual Narratives
Field research often yields messy, unstructured data including interview transcripts, observational recordings, diary studies, and usability task notes. Transforming this raw qualitative material into a compelling presentation requires disciplined synthesis rather than subjective curation. As outlined in UX Stories Communicate Designs, stories summarizing user research must accurately capture empirical insights without morphing into speculative fiction. Researchers must extract core thematic threads directly from authentic user quotes and verified behavioral patterns.
As a recommended synthesis workflow, teams can implement a systematic sequence. First, extract recurring behavioral observations from qualitative notes. Second, identify the underlying motivation driving each behavior. Third, isolate the exact breakdown points where the current system disrupts user goals. Fourth, corroborate these qualitative themes with quantitative analytics or task failure patterns, echoing the principle noted in Data Storytelling: How to Present Data That Persuades that storytelling links data to organizational choices. Fifth, frame the synthesized insight around the human stakes involved. This method preserves evidentiary integrity while delivering a crisp narrative spine.
Using Storyboards and Journey Maps as Presentation Anchors
Abstract metrics and wireframes can leave stakeholders unclear on the physical and environmental realities of user behavior. Tangible narrative artifacts bridge this conceptual gap. According to the Nielsen Norman Group's guide on Customer Journey Maps: When and How to Create Them, journey maps combine storytelling and visualization to create a shared organizational vision across disconnected departments. By mapping user phases, specific touchpoints, and emotional fluctuations across time, journey maps illuminate operational disconnects that departmental silos routinely overlook.
Similarly, storyboards provide visual context that digital wireframes cannot capture alone. While an interface screen reveals button placement, a storyboard illustrates where the user is standing, what distractions surround them, and what physical constraints affect interaction. As emphasized in brand strategy analyses such as What is Brand Storytelling? Definition, Strategy & Examples, authentic narratives position the customer as the hero while the solution functions merely as an empowering tool. Incorporating storyboards and journey maps directly into presentation decks anchors high-level discussions in genuine human experience.
Balancing Narrative Context With Quantitative Metrics
Presenters frequently encounter competing extremes: presenting anecdotal customer quotes without statistical backing, or reciting dense tables of analytics stripped of human context. Neither approach succeeds alone. Narrative without hard numbers risks dismissal as a cherry-picked outlier, while quantitative metrics without narrative context fail to motivate organizational change. In 6 Rules for Persuasive Storytelling, UX experts emphasize that compelling stories must be rooted in rigorous data to eliminate ambiguity and earn stakeholder trust.
Balancing these components requires pairing qualitative empathy with quantitative validation. For instance, an illustrative example involves presenting an onboarding funnel where analytics demonstrate drop-off during account registration. Rather than presenting funnel drop-off charts in isolation, the presenter pairs the visual data with a short video clip or direct quote showing a user bewildered by ambiguous form requirements. The narrative explains why the friction occurs, while the metric establishes scale and operational urgency. This balanced delivery satisfies analytical executives while providing product teams with clear qualitative direction.
Recognizing Narrative Bias and the Risk of Over-Simplification
While narrative is an indispensable communication mechanism, it introduces distinct ethical hazards. Narrative bias describes the cognitive inclination to prefer tidy, emotionally compelling stories over messy, complex realities. In user research, presenters risk bending data to fit a neat narrative arc, ignoring edge cases, accessibility considerations, or contradictory feedback. As cautioned in UX Stories Communicate Designs, design stories must remain strictly anchored in empirical findings; otherwise, teams risk solving imaginary problems for fictitious users.
To counter narrative bias, practitioners must incorporate methodological transparency into presentation decks. Presenters should explicitly designate sections for research limitations, sample demographics, and outlier behaviors. When a specific participant's workflow contradicts the dominant narrative arc, presenting that divergence prevents false consensus. Honest storytelling acknowledges trade-offs, system constraints, and areas requiring further discovery, reinforcing long-term design credibility across the wider organization.
Adapting Presentations for Live and Asynchronous Formats
Design findings travel through organizations in diverse formats, primarily live synchronous reviews and asynchronous executive decks. Each channel demands a distinct narrative strategy. During live synchronous presentations, slide content should remain visually spare. As highlighted in Presentation Storytelling 101: Craft Clear, Compelling Messages, presenters should use benefit-driven headlines rather than dry descriptive labels, using the spoken track to provide emotional color and nuance while slides serve as visual focal points.
Conversely, asynchronous decks must function as standalone artifacts. Executive sponsors often review shared slide decks without the original presenter present to clarify ambiguities. In these reading decks, slides require self-explanatory narrative prose, integrated contextual quotes, and clear visual annotations. As documented in 6 Rules for Persuasive Storytelling, artifacts such as journey maps, persona summaries, and concise research reports provide lasting reference points that team members can revisit long after the initial meeting.
Establishing a Continuous Narrative Practice Across Design Teams
Storytelling should not be confined to high-stakes executive pitch decks or occasional design reviews. Instead, UX organizations derive maximum value by embedding narrative disciplines throughout the everyday product lifecycle. In UX Stories Communicate Designs, researchers note that stories serve not only to communicate finished designs, but also to generate wild ideas, summarize ongoing user research, and evaluate design iterations against baseline human experiences.
Integrating narrative methods into ongoing collaborative rituals strengthens cross-functional alignment. Teams can frame regular design demos around user goals rather than technical task tickets, document design system guidelines through contextual use scenarios, and conduct project retrospectives from the user's evolving perspective. By treating narrative as a continuous discipline rather than an isolated presentation tactic, design teams foster a persistent culture of empathy that guides product development from initial concept to release.
Research sources
- UX Stories Communicate Designs - NN/G · www.nngroup.com
- Data Storytelling: How to Present Data That Persuades (2026 Guide) · www.thoughtspot.com
- What is Brand Storytelling? Definition, Strategy & Examples · www.studiobinder.com
- 7 Storytelling Frameworks for Pitch Decks That Hold Attention | Bullpen Blog | Bullpen · www.thebullpen.co
- Effective Data Storytelling: How to Drive Change with Data, Narrative and Visuals | Wiley · www.wiley.com
- 6 Rules for Persuasive Storytelling - NN/G · www.nngroup.com
- Presentation Storytelling 101: Craft Clear, Compelling Messages · www.verdanabold.com
- Customer Journey Maps: When and How to Create Them - NN/G · www.nngroup.com